Can you rent a yacht in Tenerife- do I need a license? The requirements.
Small boats (under a certain horsepower or length), electric boats, crewed yacht charters and gulet charters may not require a license. Larger boats or those with more powerful engines need a skipper’s license. Before you confirm your sailing trip to Tenerife, please send us a copy and we will check it for you. You need to have the original copies on board, so don’t forget to take them.
To sail in Spain, one of the following qualifications is necessary: • ICC (International Certificate of Competence), International, with valid Navigational and VHF licenses Prerequisites: RYA “Day Skipper Course” or complete the ICC Assessment form to prove competence from previous experience.
If you do not have a skipper license, it is also possible to rent a boat with a skipper
Yacht charter Tenerife – the main ports
Marina del Sur (Tenerife)
This port is located in the tiny fishing town of Las Galletas, in the southern part of Tenerife. They have 126 moorings for yachts as long as 20 metres. They offer running water, electricity and security services available 24/7. The maximum depth is 2 metres at low tide and 7 metres at high tide. They also have a crane on spot, which is really helpful for maintenance work. There is also a recreational centre as well as several cafés, restaurants and shops nearby.
Marina del Sur (Tenerife)
MarinaLas Galletas is located on the south coast of Tenerife. A medium-sized port capable of accommodating approximately 300 ships.
Puerto Deportivo Radazul (Tenerife)
A port in the coastal town of Radazul on the east coast of Tenerife. It offers mooring options for recreational and fishing boats. The marina is located in a picturesque bay surrounded by cliffs, with sheltered waters and stunning views of the coast.
Las Palmas (Gran Canaria)
The port La Luz, or often called Las Palmas Port, can be found halfway between Europe and the other two continents, Africa and America. Due to its suitable location, it has become one of the most important ports in the world in terms of international trade and maritime traffic. You can choose from several restaurants and bars here, and they provide drinking water, electricity, Wi-Fi and self-service laundry. yacht hire Gran Canaria
Puerto Mogán (Gran Canaria)
Located in the southwestern part of Gran Canaria, it is the beautiful port of a charming fishing village. A popular yacht harbor with a calm and friendly atmosphere. The village has plenty of shops, restaurants and bars to explore.
Marina Rubicón (Lanzarote)
It is located in the resort town of the port on the south coast of Lanzarote. A modern port capable of accommodating more than 500 ships and offering a range of services; fuel stations, boat repair and boat rental. The harbor is surrounded by shops, restaurants and leisure facilities, making it a popular destination for boaters.
Puerto Calero (Lanzarote)
It is a luxury marina on the southwest coast of Lanzarote, near the resort town of Puerto del Carmen. It offers moorings for more than 400 boats and upscale amenities such as boutiques, gourmet restaurants and a yacht club. The harbor also hosts various sailing events and regattas throughout the year. yacht charter Lanzarote
boat rentals Canary islands
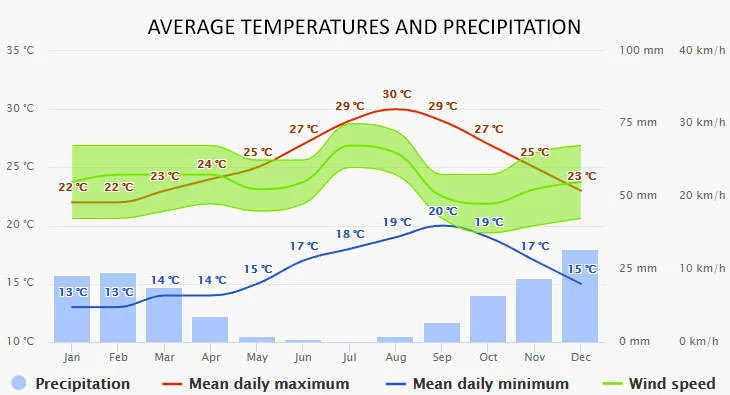
The climate diagrams are based on 30 years of hourly weather model simulations. They give good indications of typical climate patterns and expected conditions (temperature, precipitation, sunshine, and wind). The “mean daily maximum” (solid red line) shows the maximum temperature of an average day for every month for Tenerife. Likewise, the “mean daily minimum” (solid blue line) shows the average minimum temperature.
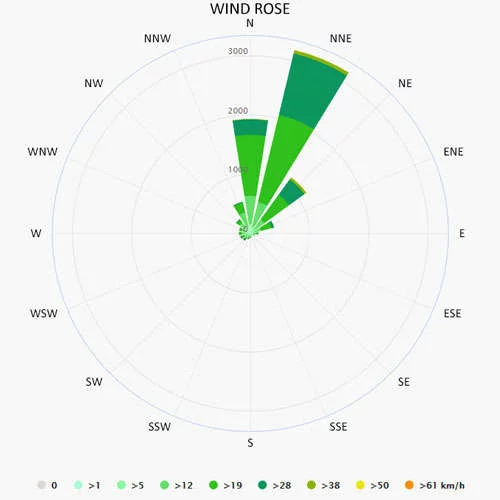
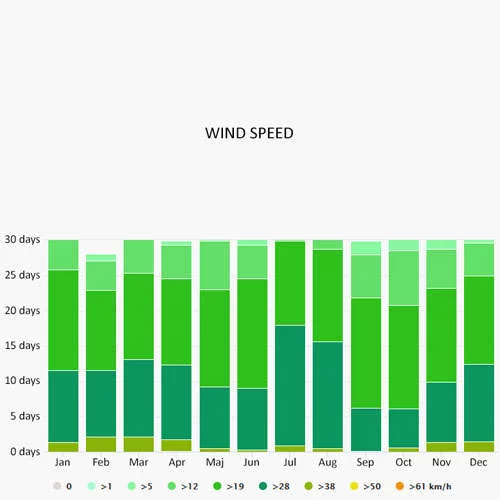
The wind rose for Tenerife shows how many hours per year the wind blows from the indicated direction. The diagram for Tenerife shows the days per month, during which the wind reaches a certain speed.