There are no boats on the list with your parameters?
We have access to a lot more boats than what we have listed on our site.
Send us this form and we will find the perfect boat for you. The shortest boat rental option is 1 day.
Can you rent a yacht in Corsica- do I need a license? The requirements.
Small boats (under a certain horsepower or length), electric boats, crewed yacht charters and gulet charters may not require a license. Larger boats or those with more powerful engines need a skipper’s license. Before you confirm your sailing trip to Corsica, please send us a copy and we will check it for you. You need to have the original copies on board, so don’t forget to take them. To sail in France, one of the following qualifications is necessary: • ICC (International Certificate of Competence), International, with valid Navigational and VHF licenses Prerequisites: RYA “Day Skipper Course” or complete the ICC Assessment form to prove competence from previous experience. If you do not have a skipper license, it is also possible to rent a yacht with a skipper
Find yacht routes in Corsica or choose another yacht charter in France.
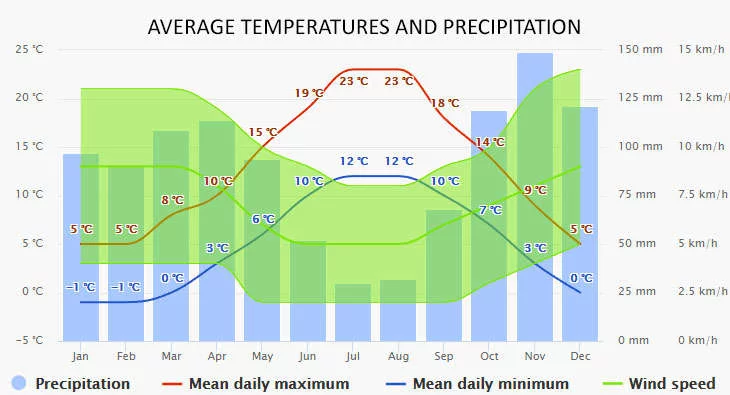
The climate diagrams are based on 30 years of hourly weather model simulations. They give good indications of typical climate patterns and expected conditions (temperature, precipitation, sunshine, and wind). The “mean daily maximum” (solid red line) shows the maximum temperature of an average day for every month for Corsica. Likewise, the “mean daily minimum” (solid blue line) shows the average minimum temperature.
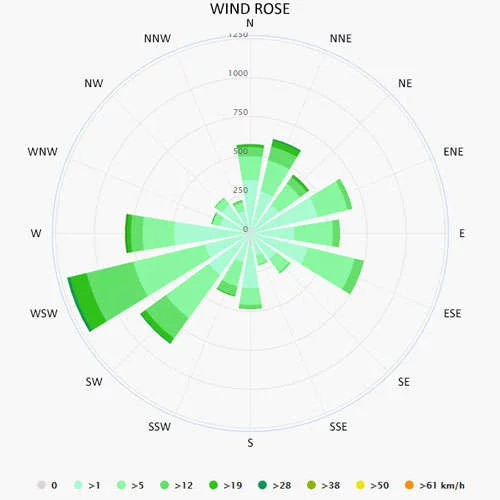
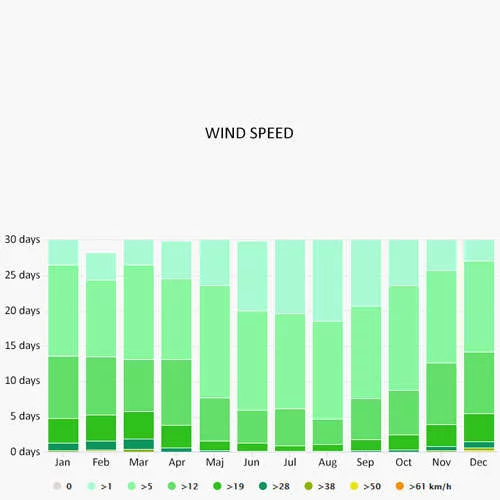
The wind rose for Corsica shows how many hours per year the wind blows from the indicated direction. The diagram for Corsica shows the days per month, during which the wind reaches a certain speed.
Day 2: Ajaccio – Bonifacio (44.3 nm – Sailing time*: about 7 hours), Day 3: Bonifacio – La Maddalena (16.2 nm – Sailing time*: about 2.5 hours), Day 4: La Maddalena – Porto Cervo (8.6 nm – Sailing time*: about 1.5 hours), Day 5: Porto Cervo – Olbia (25.4 nm – Sailing time*: about 4 hours), Day 6: Olbia – Santa Teresa Gallura (40 nm – Sailing time*: about 6.5 hours), Day 7: Santa Teresa Gallura – Ajaccio (50.2 nm – Sailing time*: about 8 hours)
* – an average 43 ft sailing yacht, with average weather conditions, sails around 6-7 knots per hour.
Day 1: Santa Teresa Gallura – Bonifacio (8.9 nm – Sailing time*: about 1.5 hours), Day 2: Bonifacio – Porto Vecchio (25.1 nm – Sailing time*: about 4 hours), Day 3: Porto Vecchio – Cala Santa Maria (23.5 nm – Sailing time*: about 4 hours), Day 4: Cala Santa Maria – Tavolara island (31 nm – Sailing time*: about 5 hours), Day 5: Tavolara – Porto Cervo (18.3 nm – Sailing time*: about 3 hours), Day 6: Porto Cervo – Porto Pollo (13.5 nm – Sailing time*: about 2.5 hours), Day 7: Porto Pollo – Porto Pozzo – Santa Teresa Gallura (12.6 nm – Sailing time*: about 2 hours)
* – an average 43 ft sailing yacht, with average weather conditions, sails around 6-7 knots per hour.
If you trust a specialist to find the ideal boat for you, or if you can’t find a suitable yacht, find us on one of our contact details, or fill out the form below. After submitting your request, we will contact you within 24 hours to answer your questions and provide solutions to your carefree journey. We will help you to find the best solution.