Change destination X
Distance
Date from
Duration
You must choose a "Date from" before specifying the duration!
Flexibility
Cabins
Berths
to
Types
Sevice Types
Length
to
Sort by:
10 % + 5 %
Bali 4.6 - 5 + 2 cab. (2024)
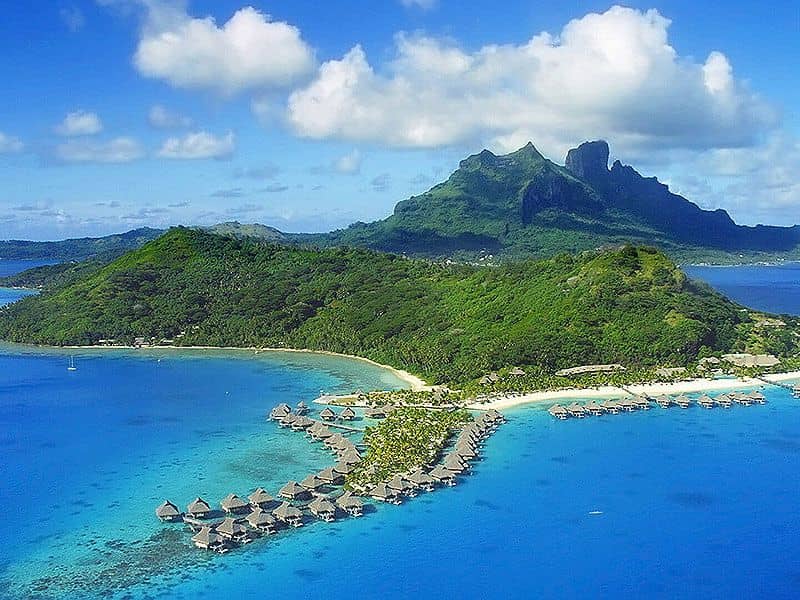
French Polynesia, Bora-Bora (Catamaran)
from 942 €/day
10 % + 5 %
Bali 4.6 - 5 + 2 cab. (2024)
French Polynesia, Bora-Bora (Catamaran)
from 942 €/day
10 % + 5 %
Bali 4.2 - 4 + 2 cab. (2024)
French Polynesia, Bora-Bora (Catamaran)
from 733 €/day
10 % + 5 %
Bali 4.2 - 4 + 2 cab. (2024)
French Polynesia, Bora-Bora (Catamaran)
from 733 €/day
10 % + 5 %
Bali Catspace (2024)
French Polynesia, Bora-Bora (Catamaran)
from 580 €/day
10 % + 5 %
Bali Catspace (2024)
French Polynesia, Bora-Bora (Catamaran)
from 580 €/day
30 %
Bali Catspace (2024)
French Polynesia, Bora-Bora (Catamaran)
from 577 €/day
10 % + 5 %
Bali Catspace (2024)
French Polynesia, Bora-Bora (Catamaran)
from 580 €/day
15 %
Bali 5.4 - 6 + 2 cab. (2024)
French Polynesia, Bora-Bora (Catamaran)
from 3 740 €/day
Bali 5.4 - 6 + 2 cab. (2024)
French Polynesia, Bora-Bora (Catamaran)
from 3 591 €/day