Can you rent a yacht in Sant Carles de la Rapita- do I need a license? The requirements.
Small boats (under a certain horsepower or length), electric boats, crewed yacht charters and gulet charters may not require a license. Larger boats or those with more powerful engines need a skipper’s license. Before you confirm your sailing trip to Sant Carles de la Rapita, please send us a copy and we will check it for you. You need to have the original copies on board, so don’t forget to take them.
To sail in Spain, one of the following qualifications is necessary: • ICC (International Certificate of Competence), International, with valid Navigational and VHF licenses Prerequisites: RYA “Day Skipper Course” or complete the ICC Assessment form to prove competence from previous experience.
If you do not have a skipper license, it is also possible to rent a boat with a skipper
Sant Carles de la Rapita yacht charters – the main ports
Port of Sant Carles de la Ràpita
The port can accommodate ships and yachts of various sizes. The harbor is well protected and provides a well-equipped, safe environment for ships.
Port El Masnou
The Port of El Masnou offers 1, 058 berths and it can accommodate boats up to 22 m in length. The port boasts some splendid amenities including 24/7 security service, refuelling and a maintenance station. You can also find some cosy bars and restaurants with terraces nearby. El Masnou sailing, boat rental El Masnou
Port of Sitges
The port of the town is known as El Port Esportiu de Sitges Aiguadolc. There are 742 permanent berths for boats with a maximum length of 32 metres. There are great bars and restaurants around the port. Sitges sailing, boat rental Sitges
Club Nautic Cambrils
Thanks to the reforms implemented in recent years, the club has two parts. It can accommodate up to 426 yachts between 8 metres and 25 metres in size. Moreover, there are eight premises that cover a wide range of vessel maintenance and repair services. There is a 24-hour crew service. You can also find a bar and a restaurant here, and of course, there is free Wi-Fi-access available. Cambrils sailing yacht charter Cambrils
Port Vell
Barcelona is one of the most important port cities in the Mediterranean. The Port Vell can accommodate 148 vessels up to 190 metres long yachts. Drinking water, electricity and cable TV are available. Barcelona sailing, boat rental Barcelona
Port de Blanes
The port is run by Blanes Sailing Club. It provides 309 berths for yachts up to 24 metres in size. The club has a café, a restaurant and a sailing school, too. The port combines recreational sailing with commercial fishing activities. Blanes sailing, boat rental Blanes
Marina Palamós
The marina offers 866 berths and is able to accommodate boats up to 30 m in length and the maximum water depth reaches 10 m. There are fantastic facilities including maintenance station and access to drinking water, electricity and showers. Palamos sailing, boat rental Palamos
Club Nàutic Estartit
This port is located in the L’Estartit resort. It has 643 berths for yachts up to 32 metres in size. The port has a depth of 2.3 metres. There are a number of excellent services available. There is also a bar and a restaurant. L’Estartit sailing
Port of Empuriabrava (Roses)
They often refer to the city as “The Venice of Spain”. One of the largest ports of the world can be found here, with 5, 000 moorings for locals and visitors. 700 of these are preserved for tourists and can accept 26 metre-long yachts. The place offers modern facilities and equipment. For instance, if you are hungry, you can choose from 50 restaurants.
Port of Roses
The new port provides berths for around 486 vessels. The entrance is app. 70 metres wide and 9 metres deep; the minimal depth in the other parts is 3.5 metres. The port provides modern services and great amenities. Roses sailing, boat rental Roses
Salou Marina
The Club Nàutic Salou has moorings for boats ranging from 4 to 24 meters in length, and dry storage for boats up to 6.5 meters. boat rental Salou
Costa Barava sailing routes, Costa Barava boat rental
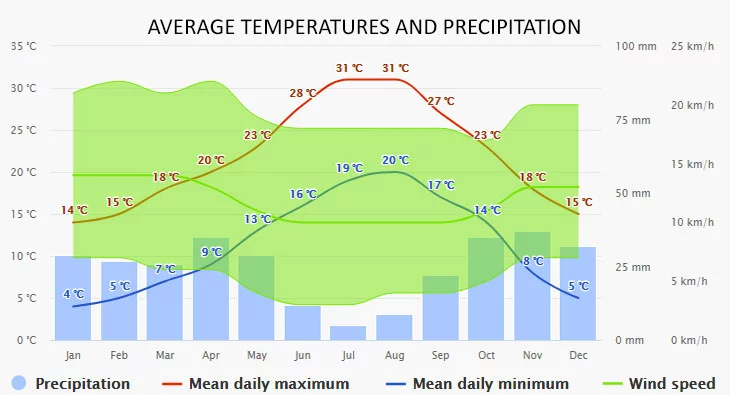
The climate diagrams are based on 30 years of hourly weather model simulations. They give good indications of typical climate patterns and expected conditions (temperature, precipitation, sunshine, and wind). The “mean daily maximum” (solid red line) shows the maximum temperature of an average day for every month for Sant Carles de la Rapita. Likewise, the “mean daily minimum” (solid blue line) shows the average minimum temperature.
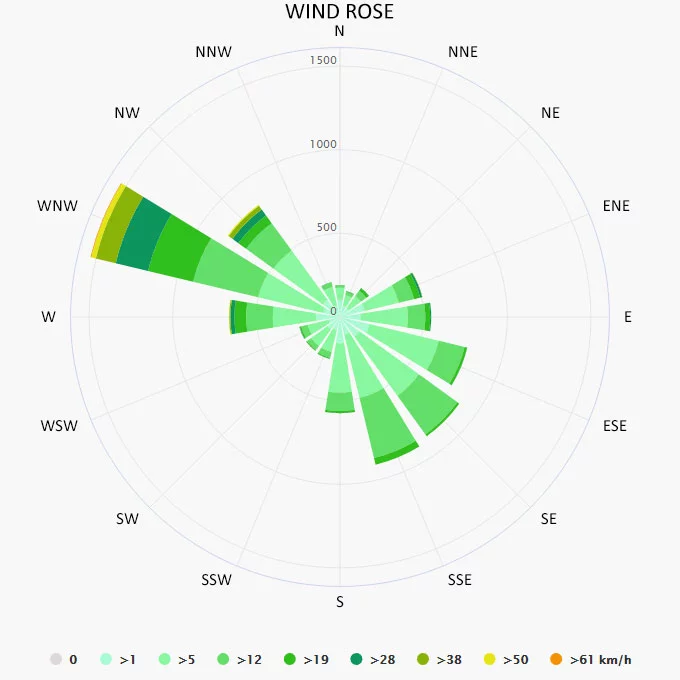
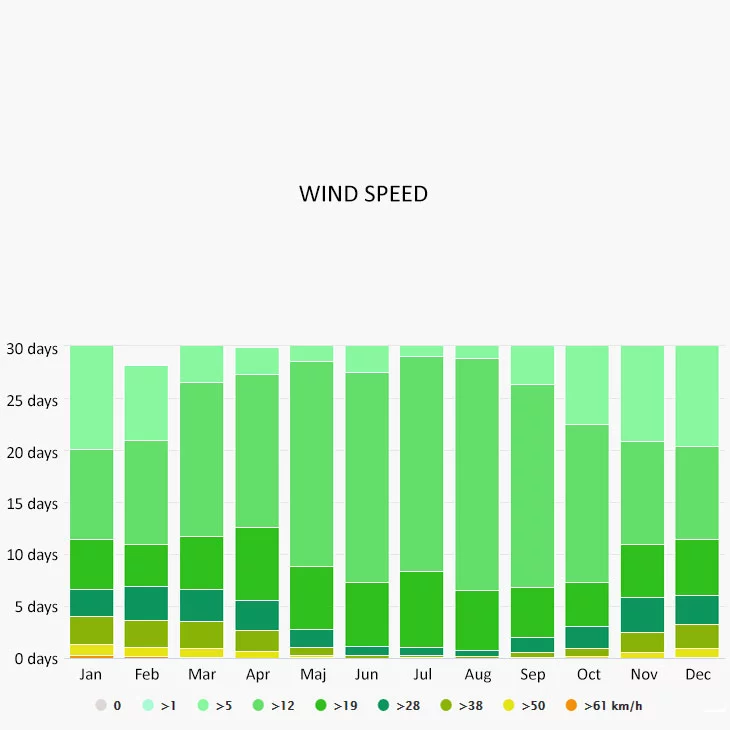
The wind rose for Sant Carles de la Rapita shows how many hours per year the wind blows from the indicated direction. The diagram for Sant Carles de la Rapita shows the days per month, during which the wind reaches a certain speed.